
THE
ENVIRONMENT
Our environmental efforts have continued to expand since the company’s inception. Our strategy is designed to protect the environment and the communities by working transparently with stakeholders. We’ve continued to focus on solutions to manage our environmental risks and impacts, limit emissions and minimize our environmental footprint.
GHG EMISSIONS
O3 Mining’s greenhouse gas (GHG) emissions inventory is presented below. This section presents O3’s emissions from January 1st to December 31st of each year. Some hypotheses and estimates to the best of our knowledge have been included to estimate emissions from some sources/activities. Year after year thoses hypotheses and estimates will be refined.
METHODOLOGY
The inventory has been produced following the guidelines of the GHG Protocol developed in partnership by the World Resources Institute (WRI) and the World Business Council for Sustainable Development (WSCSD) and ISO 14064-1: Specification with guidance at the organization level for quantification and reporting of greenhouse gas emissions and removals.
The consolidation approached used by O3 Mining to establish its inventory is a financial/operational control approach. The emissions included in its inventory are those of the activities O3 Mining controls. In this inventory, the boundaries are limited to our two main projects in the Val-d’Or camp: Marban and Alpha.
The GHG emissions attributable to an organization are divided in three categories: scope 1: direct emissions, scope 2: indirect emissions (related to electricity consumption) and scope 3 other indirect emissions (emissions linked with the business objective of the organization).
Scope 1
The direct emissions included in the inventory are:
- Fuel consumption in mobile equipment such as gas and diesel
- Propane consumption for a rented premises
In 2021, O3 Mining had approximately 12 pick-up trucks and 6 all-terrain vehicles
In 2022, the fleet was 8 pick-up trucks and 7 all-terrain vehicles
Scope 2
O3 Mining does not own its Val-d’Or camps, however, the electricity consumption is under the control of O3. Hence GHG emissions from the consumption of electricity is included in scope 2. In 2022, emissions from the following camps are include:
- 11 Finlay street
- 23 Finlay street
Scope 3
The inclusion of scope 3 emissions is optional according to the GHG quantification guidelines. Integrating scope 3 emissions from activities closely related to the objectives of O3 Mining’s business is good practice and gives a more complete portrait of the impact the organization has on GHG emissions.
As an exploration and development company, drilling is one of its core activities. O3 Mining subcontracts the drilling activities to drilling companies therefore the emissions related to the drilling activities cannot be considered O3 Mining direct emissions. However, since it’s a core activity O3 mining includes these emissions in its scope 3 emissions. The GHG emissions regarding the tree-clearing activities to prepare our drill sites and to access them are also subcontracted activities that we include in our scope 3 emissions.
The GHG emissions included from the drilling and tree-clearing companies are:
- Diesel used in the drills
- Propane used on drilling sites
- Gas and diesel in mobile equipment from drilling and tree-clearing companies
- Gas in pump shacks
To estimate the GHG emissions, the calculation methodologies and emissions factors contained in the Government of Québec’s GHG reporting regulation were privileged. Table below details the available information for each emission source, the hypotheses used for missing information (when applicable, and the reference used to determine the emission factors used in each calculation.
The global warming potential (GWP) uses to present the results in tonnes of CO2 equivalents (CO2e) of the IPCC Fourth Assessment report.
* RDOCECA: Québec’s GHG emission reporting regulation
GHG EMISSIONS
Table below shows O3 Mining’s total emissions estimate per scope.
Scope 3 is the most predominant emissions source.
| 2021 | 2022 | |
| Scope 1 (t CO2e) | 58,9 | 65,7 |
| Scope 2 (t CO2e) | 0.43 | 0,44 |
| Scope 3 (t CO2e) | 5 014,3 | 2 067,8 |
| Total (t CO2e) | 5 073,6 | 2 133,9 |
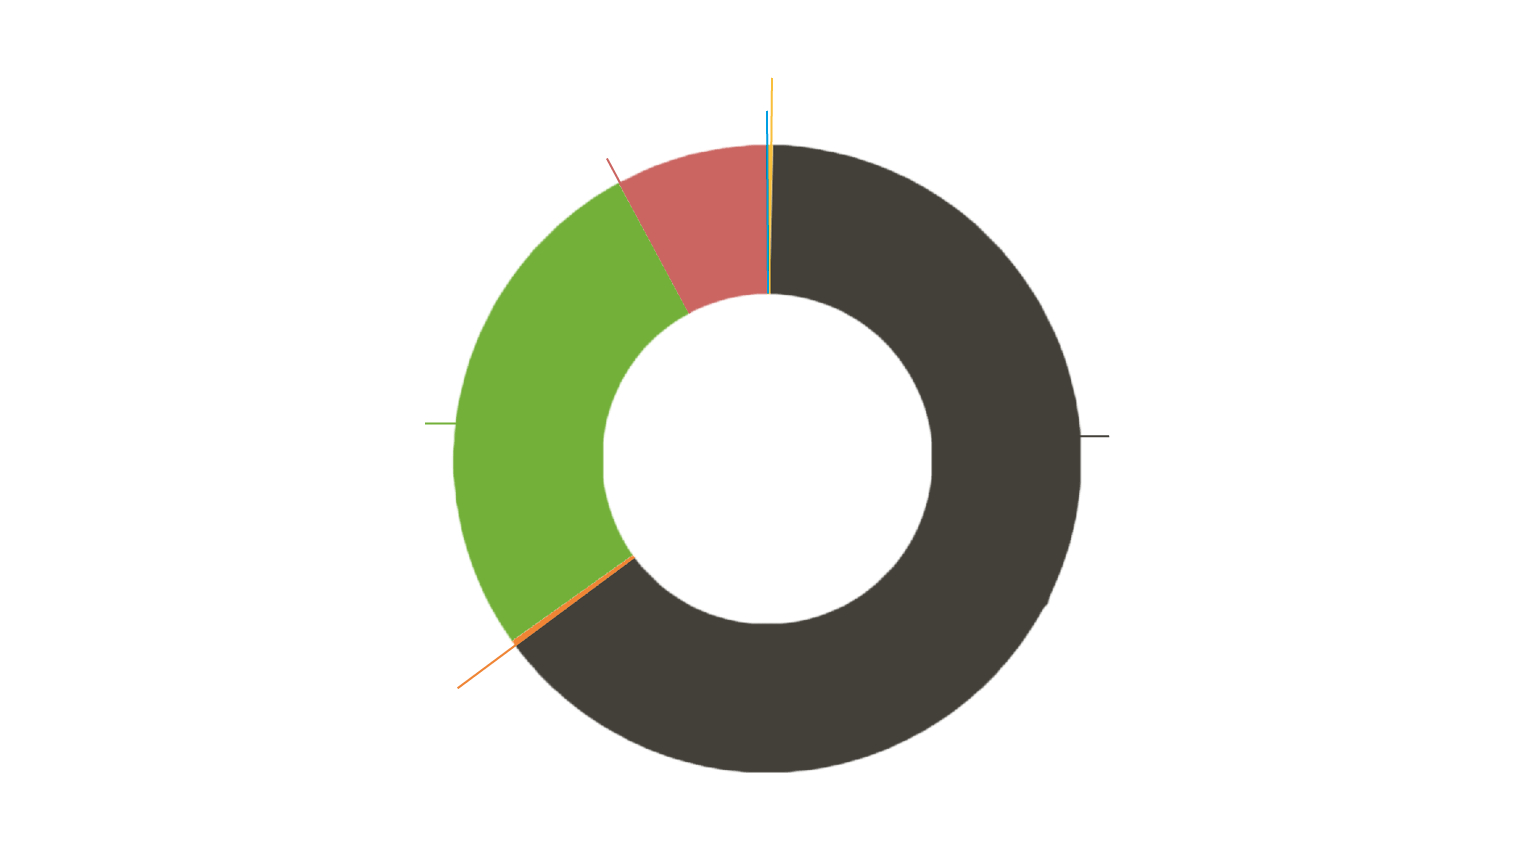
GHG EMISSIONS
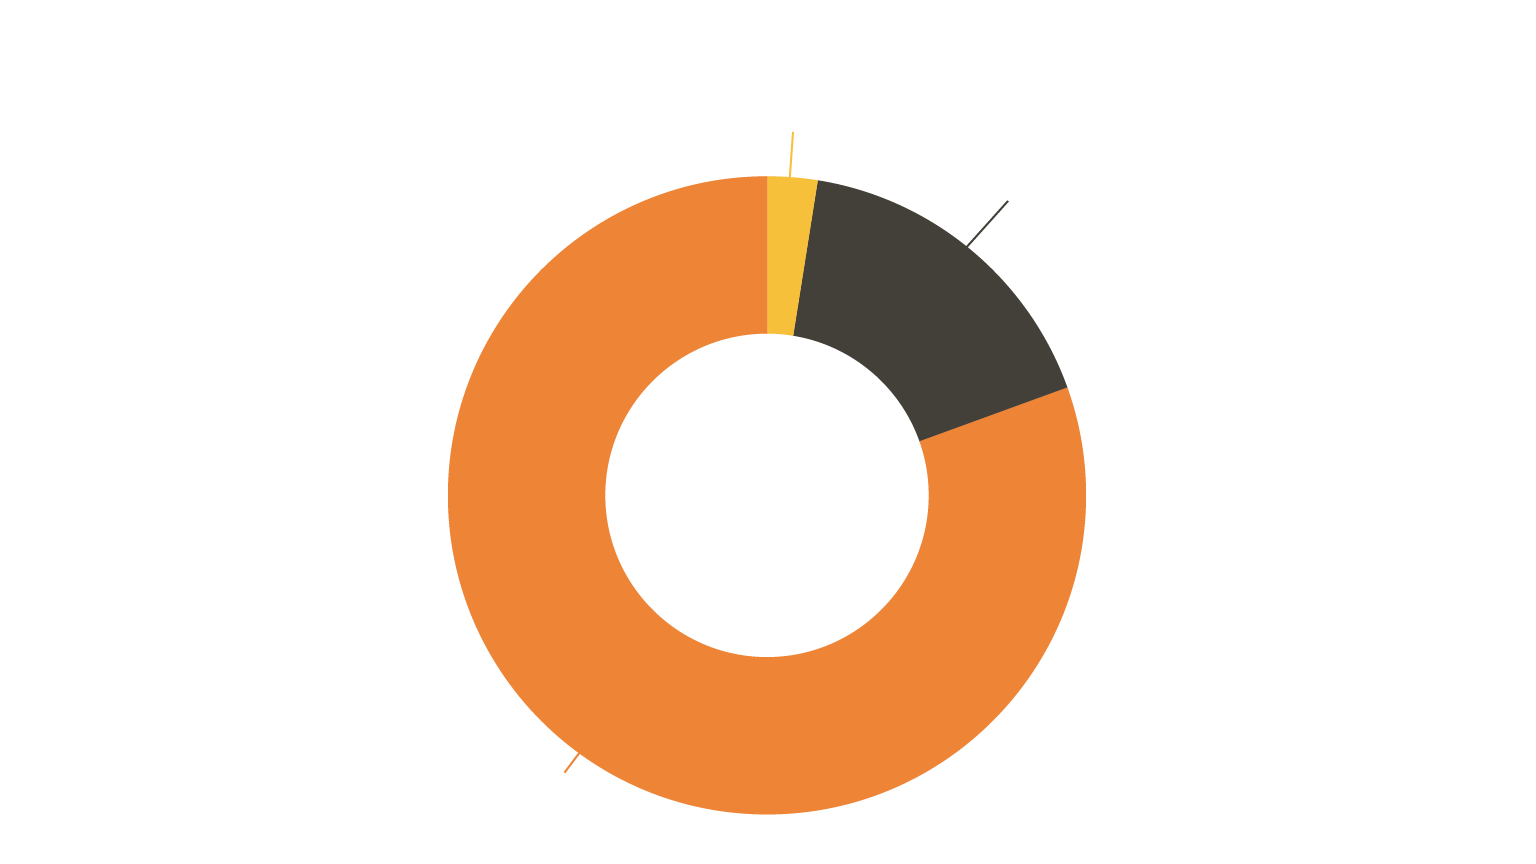
Graph 3.1 – GHG emissions per scope
As shown in graph 3.2, the stationary emissions are predominant versus the mobile equipment emissions.
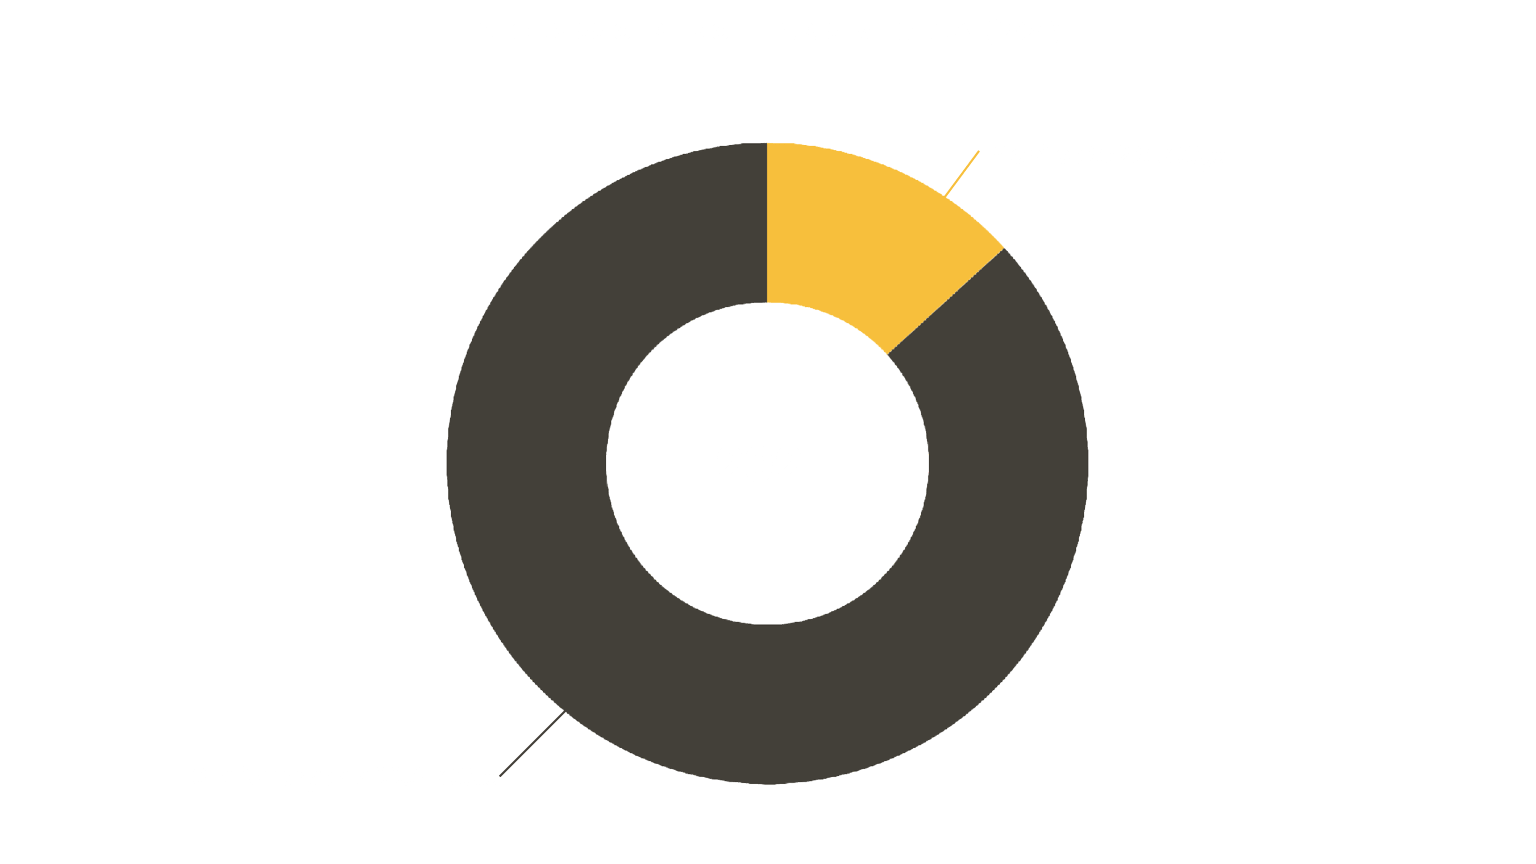
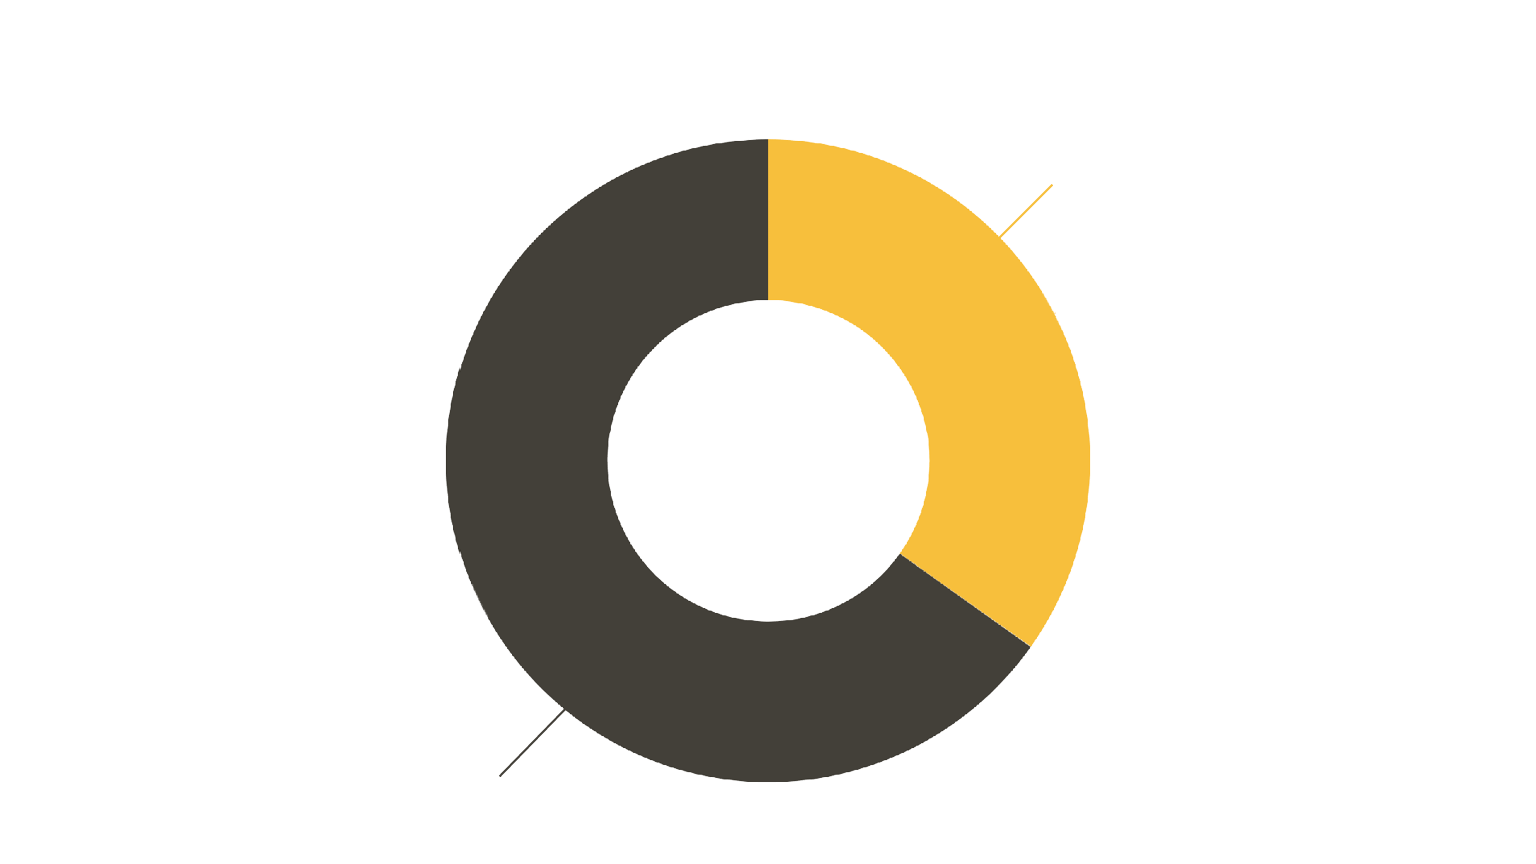
Graph 3.2 GHG Emissions –Stationary versus mobile equipment
The drills comprise the highest emitting activity as shown in graph 3.3.
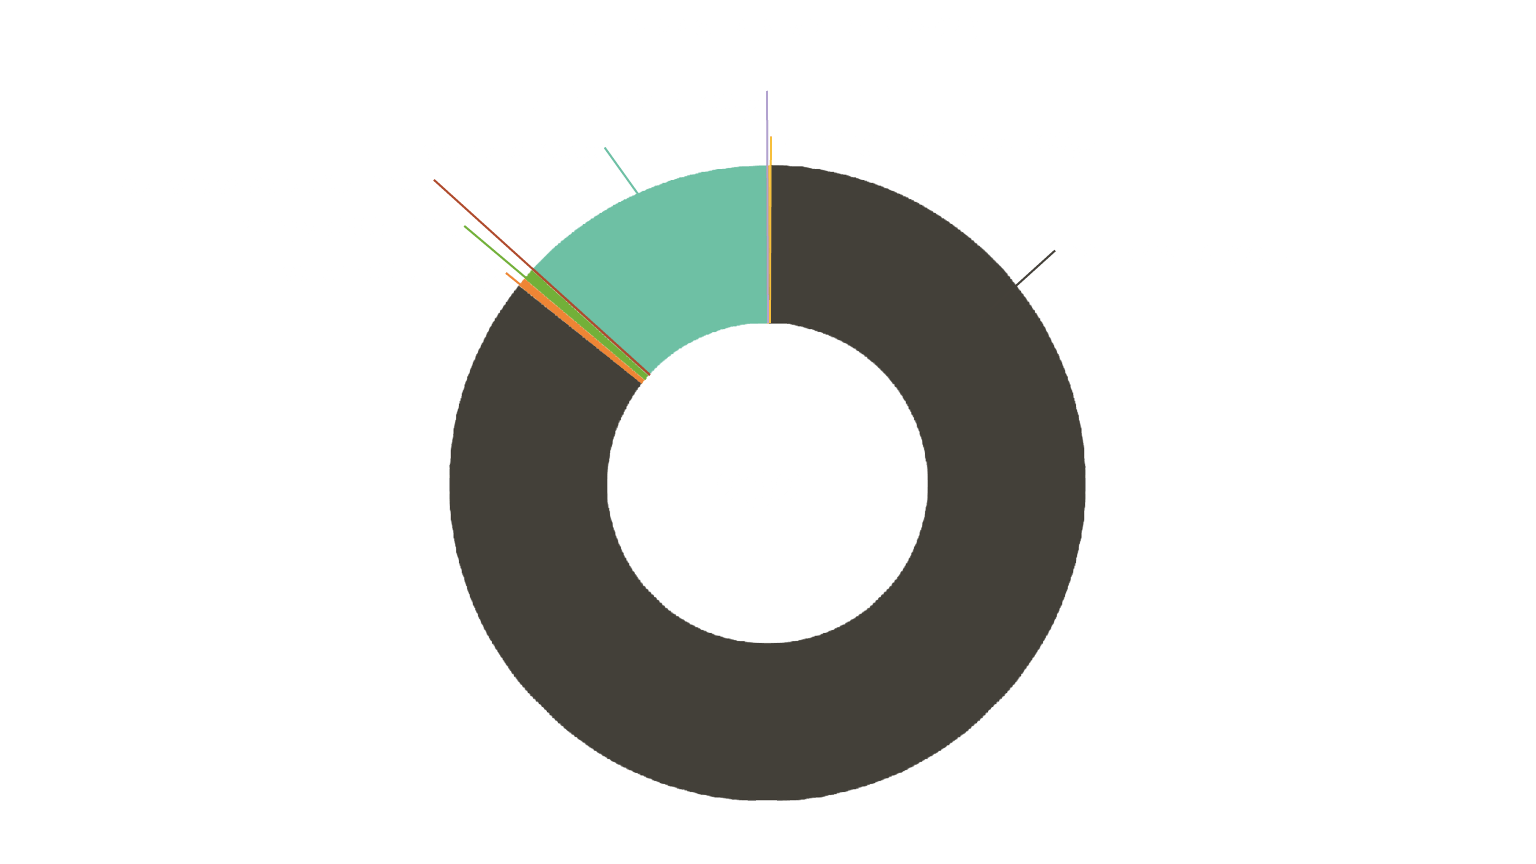
Graph 3.3 –GHG emissions per activity
LIMITS AND UNCERTAINTIES
The main challenge in a GHG inventory is to collect reliable and precise data on the emissions sources included in the inventory.
Since we are using service suppliers obtaining the ECOLOGO certification, we expect the data provided by our suppliers will be more reliable and precise as we advance in this process.
As part of their certification, they are also required to produce their GHG emissions inventory.
Notwithstanding, O3 Mining’s GHG inventory portrays a good representation of the emissions from O3’s activities. As good practice, the table below presents the limits and uncertainties related to the data and calculations of the inventory.