After-Tax NPV of C$321M, 33.0% IRR at US$1,450/oz Gold
Toronto, December 14, 2020 – O3 Mining Inc. (TSX.V:OIII) (“O3 Mining” or the “Corporation”) is pleased to announce positive results from the independent Preliminary Economic Assessment (“PEA”) on its 100 percent owned Garrison project in the Kirkland Lake region in Ontario, Canada. The PEA has been prepared by Ausenco Engineering Canada Inc. (“Ausenco”) in accordance with National Instrument 43-101 – Standards of Disclosure for Mineral Projects (“NI 43-101”).
Highlights of the PEA*
(All figures are stated in Canadian dollars unless otherwise stated)
- Long-term gold price: US$1,450/oz
- Exchange rate: C$1.00 = US$0.75
- After-tax net present value (“NPV”) at 5% discount rate: $321 million
- After-tax internal rate of return (“IRR”): 33.0%
- After-tax payback period: 2.3 years
- Initial capital (“CAPEX”): $267 million for a 4.0 million tonne per year processing plant including mine preproduction, infrastructure (roads, power line relocation, tailings facility, ancillary buildings, and water management)
- Life of mine (“LOM”): 12 years
- Average LOM strip ratio (waste: mined resource): 2.7
- Total mill feed of 47.3 million tonnes resulting in LOM gold production of 1.1 Million oz
- LOM Plan: 82% of total mill feed was sourced from mineral resources classified in the Measured and Indicated category
- Average annual gold production of 121,000 oz in years 1 to 8 (94,000 oz for LOM)
- Average mill head grade of 1.04 g/t gold in years 1 to 8 (0.82 g/t for LOM)
- Average mill recovery: 89.8%
- Measured and Indicated Mineral Resource of 66.3 Mt at 0.86 g/t Au grade
- Cash Cost: US$721/oz
- All-in Sustaining Cost (“AISC”): US$818/oz
* Cautionary Statement: The reader is advised that the PEA summarized in this news release is intended to provide only an initial, high-level review of the project potential and design options. The PEA mine plan and economic model include numerous assumptions and the use of inferred mineral resources. Inferred mineral resources are considered to be too speculative to be used in an economic analysis except as allowed for by NI 43-101 for PEA studies. There is no guarantee that inferred mineral resources can be converted to indicated or measured mineral resources, and as such, there is no guarantee the project economics described herein will be achieved.
O3 Mining is pleased to present the results of a PEA on its Garrison Project for an 11,000 tonnes per day open pit mining and Carbon in Leach processing operation with production spanning 12 years clearly demonstrating the potential for the company to become a major North American gold producer. The PEA delivers robust economics with an after-tax IRR of 33.0% and after-tax NPV of $321M at a US$1,450/oz gold price, with very attractive cash costs and AISC, low CAPEX and low capital intensity. The project will target production in excess of 121,000 ounces gold per year during years 1 to 8, while peaking at more than 155,000 ounces in Year 2.
Garrison has been in the shadow of our Marban and Alpha properties in Québec but as this PEA shows, it is an integral part of the value proposition of O3 Mining. Garrison came from Osisko Mining Inc., which completed first-class exploration work that defined the initial resource. We have worked with Ausenco to produce a high-quality PEA that focuses on capital efficiency and demonstrates the value of Garrison to O3 Mining. Today, Garrison is a 2.9-million-ounce deposit in the heart of one of the most recognised mining districts in Canada. We are thrilled that the PEA has shown a production profile of 121,000 ounces per year during the first eight years at very attractive economics. The Corporation is ready to maximize Garrison’s value by advancing the studies to further de-risk the project,” Jose Vizquerra, President, CEO and Director of O3 Mining.
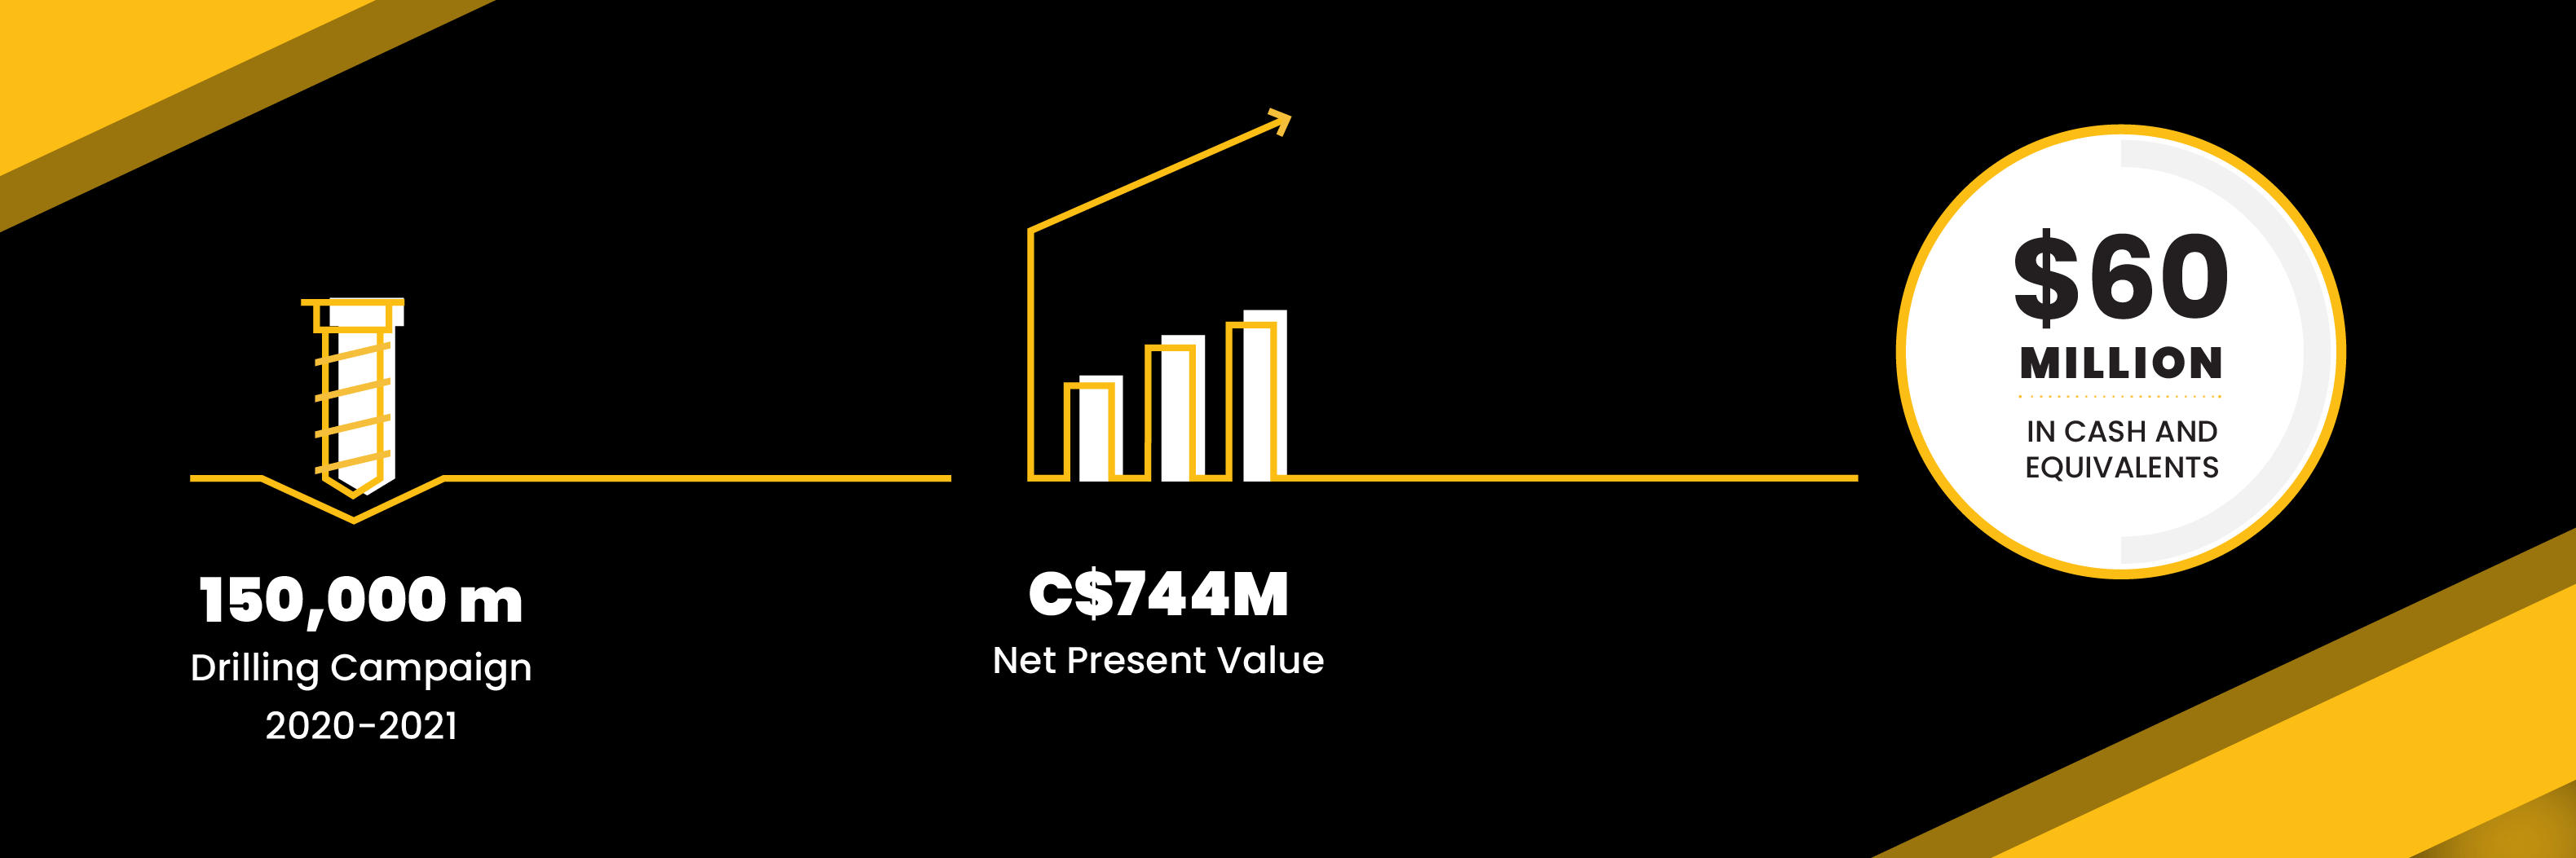
The Garrison PEA demonstrates an NPV of $321 million which follows hot on the heels of our Marban PEA (See Press Release September 8, 2020) in Québec which also demonstrated compelling project economics with an after-tax NPV of $423 million, an IRR of 25.2% with a 15 year mine life and an average annual gold production of 115,000 oz. Together these PEAs mark the transition of O3 Mining from an explorer to an up-and-coming gold developer with a total NPV of $744 million of fundamental value,” added Mr. Vizquerra.
The Corporation looks forward to working with its partners in the Timmins-Kirkland Lake area including the Matheson municipalities and the Wahgoshig First Nation community (Wahgoshig) as well with the support of the Ontario and federal governments, to advance the Garrison Project.
Overview
Ausenco was appointed as lead consultant on September 16, 2020 to prepare the PEA in accordance with NI 43-101, and was assisted by Moose Mountain Technical Services.
The Garrison Project is located in Timmins-Kirkland Lake area of northeastern Ontario along the Highway 101 corridor, approximately 40 km east of Matheson, 40 km north of town of Kirkland Lake, and 100 km east of the city of Timmins). Geologically, the project is situated along the Porcupine-Destor break in the Abitibi Greenstone Belt (AGB) and contains the Garrcon, JonPol, and 903 Deposits.
Financial Analysis
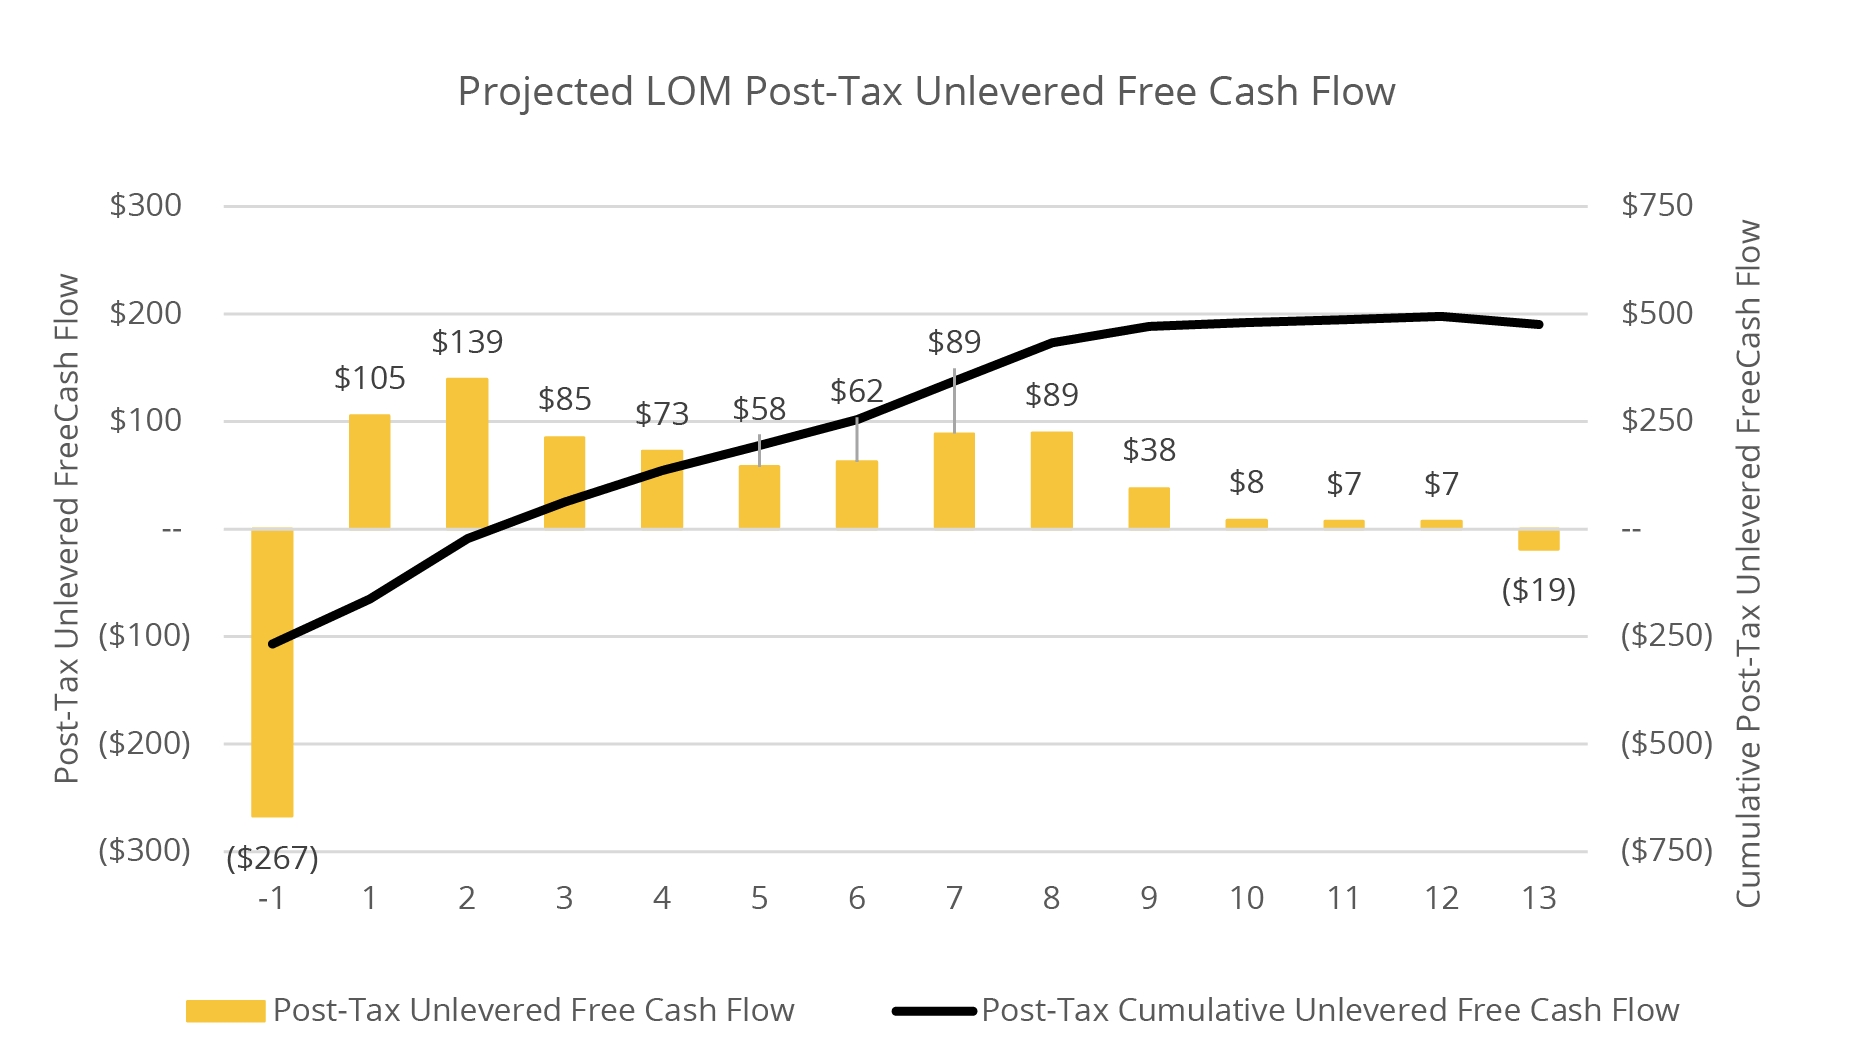
The economic analysis was performed assuming a 5% discount rate. On a pre-tax basis, the NPV5% is $470 million, the IRR is 41.1% and the payback period is 2.0 years. On an after-tax basis, the NPV5% is $321 million, the IRR is 33.0% and the payback period is 2.3 years. A summary of project economics is listed in (Table 1) and shown graphically in the figures below.
Table 1: Summary of project economics
| GENERAL | LOM TOTAL / AVG. |
|---|
| Gold Price (US$/oz) | $1,450 |
| Exchange Rate ($US:$CAD) | 0.75 |
| Mine Life (years) | 12.0 |
| Total Waste Tonnes Mined (kt) | 128,260 |
| Total Mill Feed Tonnes (kt) | 47,343 |
| Strip Ratio | 2.7 |
| PRODUCTION | LOM TOTAL / AVG. |
| Mill Head Grade (g/t) (Average gold mill head grade of 1.04 g/t in years 1 to 8) | 0.82 |
| Mill Recovery Rate (%) | 89.8% |
| Total Mill Ounces Recovered (koz) | 1,126 |
| Total Average Annual Production (koz) | 94 |
| OPERATING COSTS | LOM TOTAL / AVG. |
| Mining Cost ($/t Mined) | $2.7 |
| Mining Cost ($/t Milled) | $9.9 |
| Processing Cost ($/t Milled) | $11.2 |
| G&A ($/t Milled) | $1.0 |
| Total Operating Costs ($/t Milled) | $22.1 |
| Refining & Transport Cost ($/oz) | $2.5 |
| Royalty NSR | 1.5% |
| Cash Costs (US$/oz Au) | $721 |
| AISC (US$/oz Au) | $818 |
| CAPITAL COSTS | LOM TOTAL / AVG. |
| Initial Capital ($M) | $267 |
| Sustaining Capital ($M) | $126 |
| Closure Costs ($M) | $30 |
| Salvage Costs ($M) | $11 |
| FINANCIALS – PRE TAX | LOM TOTAL / AVG. |
| NPV (5%) ($M) | $470 |
| IRR(%) | 41.1% |
| Payback(years) | 2.0 |
| FINANCIALS – POST TAX | LOM TOTAL / AVG. |
| NPV (5%) ($M) | $321 |
| IRR (%) | 33.0% |
| Payback (years) | 2.3 |
| NPV/ Initial CAPEX | 1.2 |
Notes
* Cash costs consist of mining costs, processing costs, mine-level general & administrative expenses and refining charges and royalties.
** AISC includes cash costs plus sustaining capital, closure cost and salvage value.
Figure 1: Projected Annual and Cumulative LOM Post-Tax Unlevered Free Cash Flow
Sensitivity
A sensitivity analysis was conducted on the base case pre-tax and after-tax NPV and IRR of the project, using the following variables: metal price, total CAPEX (initial + sustaining), total operating cost and exchange rate. The tables below provide a summary of the sensitivity analysis.
Table 2a: Post-Tax NPV(5%) Sensitivity
GOLD PRICE
US$/Oz | BASE CASE | INITIAL CAPEX(-25%) | INITIAL CAPEX (+25%) | OPEX
(-25%) | OPEX (+25%) | FX
(-25%) | FX (+25%) |
|---|
| $1,100 | $47 | $111 | ($16) | $186 | ($112) | $333 | ($162) |
| $1,250 | $167 | $230 | $103 | $301 | $25 | $484 | ($38) |
| $1,450 | $321 | $384 | $257 | $452 | $185 | $686 | $96 |
| $1,750 | $547 | $611 | $484 | $679 | $415 | $989 | $283 |
| $2,000 | $737 | $801 | $673 | $868 | $605 | $1,242 | $434 |
Table 2b: Post-Tax IRR Sensitivity
GOLD PRICE
US$/Oz | BASE CASE | INITIAL CAPEX(-25%) | INITIAL CAPEX (+25%) | OPEX
(-25%) | OPEX (+25%) | FX
(-25%) | FX (+25%) |
| $1,100 | 10.2% | 20.4% | 3.5% | 22.0% | 0.0% | 34.0% | 0.0% |
| $1,250 | 21.2% | 33.5% | 13.3% | 30.8% | 8.2% | 44.6% | 0.1% |
| $1,450 | 33.0% | 48.3% | 23.6% | 41.5% | 23.5% | 58.2% | 15.0% |
| $1,750 | 49.0% | 68.7% | 36.9% | 56.7% | 40.8% | 77.2% | 30.2% |
| $2,000 | 61.5% | 84.8% | 47.3% | 68.7% | 53.9% | 92.5% | 41.1% |
Mineral Resource
The Mineral Resource is estimated from a drill hole database containing 1,378 drill holes within the model boundaries, including 257,889 assay intervals for a total assayed length of 258,223 metres. Interpolations are done using multiple indicator kriging (MIK) within four domains defined by lithology and faulting. Classification to Indicated is based on the average distance to two drill holes of less than 25-50 metre spacing depending on the domain.
Classification is then adjusted to ensure continuity of blocks with Inferred adjusted to minimize extrapolation of grades. The base case cut-off grade is 0.30 g/t Au based on metallurgical recoveries, Processing + G&A costs of $14.50/tonnes and a US$1,400/oz Au price, with smelter terms as detailed in the notes below. The Measured and Indicated mineral resource is estimated at 66.3 Mt at 0.86 g/t Au for a total of 1.8Moz, and the Inferred Mineral resource is 45.3Mt at 0.73 g/t Au for a total of 1.1Moz. Table 3 summarizes the Resource Estimate at a 0.3g/t cut-off.
Table 3: Mineral Resource Estimate (effective date November 25, 2020)
| CLASS | SOURCE | TONNAGE (Kt) | AU (G/T) | AU METAL (kOz) |
| Indicated | 903 Jonpol Garrcon | 27,558 17,786 20,923 | 0.843 0.914 0.821 | 747 523 552 |
| All Indicated | 66,268 | 0.855 | 1,822 |
| Inferred | 903 Jonpol Garrcon | 30,760 7,521 7,056 | 0.690 0.756 0.866 | 682 183 197 |
| All Inferred | 45,337 | 0.729 | 1,062 |
Notes:
- The Mineral Resource estimate has been prepared by Sue Bird, P.Eng., an independent Qualified Person, from Moose Mountain Technical Services.
- Resources are reported using the 2014 CIM Definition Standards and were estimated in accordance with the CIM 2019 Best Practices Guidelines.
- Mineral Resources that are not Mineral Reserves do not have demonstrated economic viability.
- The open-pit Mineral Resource has been confined by a “reasonable prospects of eventual economic extraction” pit shell generated using the following assumptions: US$1,800/oz. Au at a currency exchange rate of 0.75 US$ per C$; 99.95% payable Au; $4.30/oz Au offsite costs (refining, transport and insurance); a 2% NSR royalty; $14.50/t process and G&A costs; $2.40/t mining costs and pit slopes of 25 degrees in the overburden and 40 degrees below the overburden. Metallurgical recovery is 90.5% at 903, 95.5% at Garrcon, 92.45% at JonPol-non-refractory and 56.2% in JonPol-refractory.
- The specific gravity of the deposit has been determined by lithology as being between 2.74 and 3.32.
- Numbers may not add due to rounding.
There are no other known factors or issues that materially affect the Mineral Resource estimate other than normal risks faced by mining projects in the province in terms of environmental, permitting, taxation, socio-economic, marketing, and political factors and additional risk factors as listed in the “Cautionary Note Regarding Forward-Looking Information” section below.
Mining
The mine plan includes 47 Mt of mill feed and 128 Mt of waste over the 12-year mine life coming from three deposits: 903, Jonpol, and Garrcon. Mine planning is based on conventional open-pit methods suited for the project location and local site requirements. Owner-operated and managed open pit operations are anticipated to begin one year prior to mill start-up, run for nine years to pit exhaustion, followed by three years of low-grade stockpile reclamation to the mill. The subset of Mineral Resources contained within the targeted open pit shells, summarized in Table 4 with a 0.30 g/t Au cut-off grade, forms the basis of the PEA mine plan and production schedule.
Table 4: PEA Mine Plan Production Summary
| CATEGORY | VALUE |
| PEA Mill Feed | 47,343 kt |
| Average Mill Feed Gold Head Grade | 0.82 g/t Au |
| Waste Overburden and Rock | 128,260 kt |
| Strip Ratio | 2.7 |
| Mill Feed Gold Grade (Years 1-5) | 1.11 g/t Au |
| PEA Mill Feed | 47,343 kt |
Notes:
- The PEA Mine Plan and Mill Feed estimates are a subset of the December 10, 2020 Mineral Resource estimate and are based on open-pit mine engineering and technical information developed at a Scoping level for the 903, JonPol, and Garrcon deposits.
- PEA Mine Plan and Mill Feed estimates are mined tonnes and grade, the reference point is the primary crusher.
- Cut-off grade 0.30 g/t Au assumes US$1,400/oz. Au at a currency exchange rate of 0.75 US$ per C$; 99.95% payable gold; $4.30/oz offsite costs (refining, transport, and insurance); a 2.0% NSR royalty; and a 90% metallurgical recovery.
- The cut-off grade covers processing costs of $12.00/t, administrative (G&A) costs of $1.00/t, and low-grade stockpile Rehandle costs of $1.50/t.
- Mining dilution of 20% at 0.10 g/t is applied to the in-situ Mineral Resources. Mining Recovery of 96% of diluted tonnages is assumed.
- Estimates have been rounded and may result in summation differences.
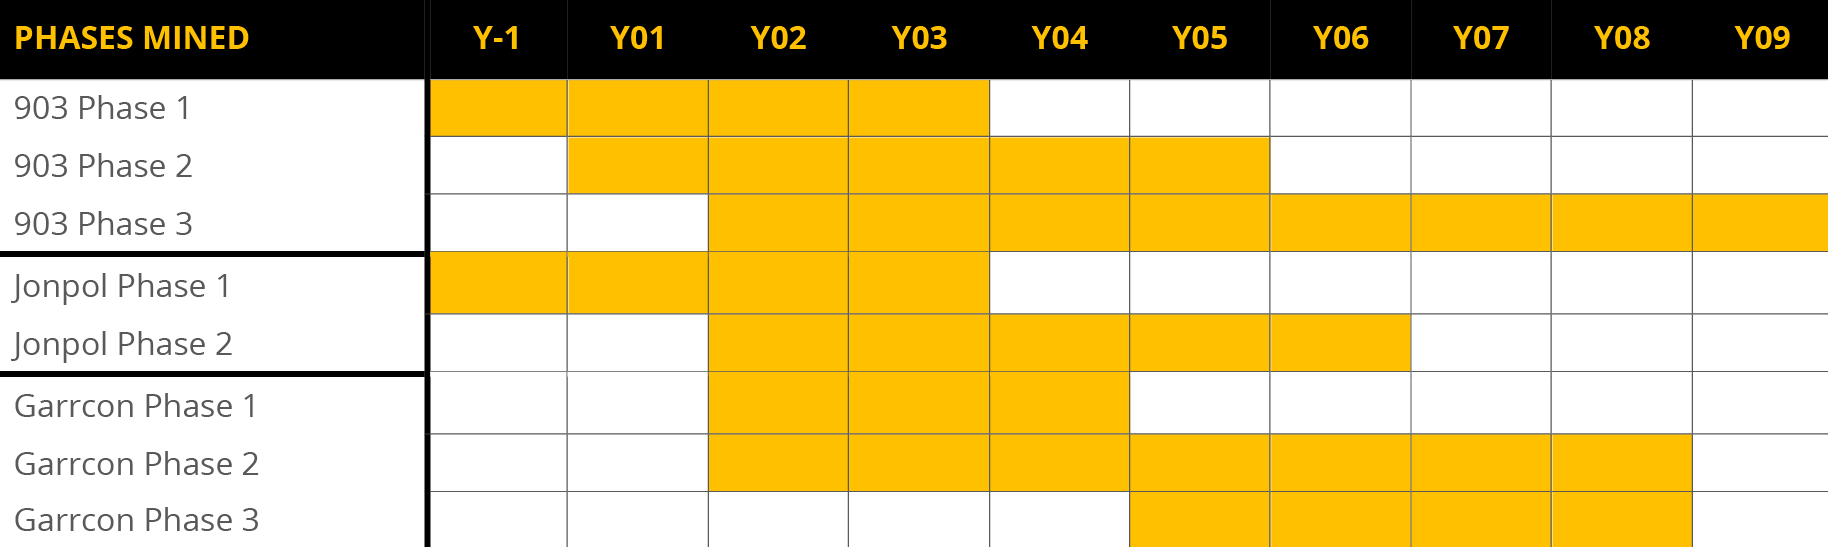
The economic pit limits are determined using the Pseudoflow algorithm. The 903 deposit is planned as one pit split into three phases or pushbacks. The Jonpol deposit is planned as one pit split into two phases. The Garrcon deposit is planned as five pits with the largest (western) pit split into 2 phases. Pit shells are generated with 40-degree overall slope angles in bedrock and 25-degree slope angles in the overburden.
Detailed pit configurations with benching and ramps have not been carried out. Chosen phase shell targets have room for these details to be added in future planning and modifications to pit contents are not expected to be materially altered. General pit sequencing is shown in Table 5 below.
Table 5: PEA Mine Plan Pit Sequencing
The mill will be fed with material from the pit at an average rate of 4.0 Mtpa (11ktpd). Cut-off grade optimization is employed, which feeds a low-grade stockpile north of the primary crusher, which is planned for reclamation to the mill in the later years of the mine life. Overburden will be placed in various stockpiles throughout the project. Waste rock will be placed in two main stockpiles adjacent to all pits. The mine plan includes backfill of waste rock into the smaller mined out Garrcon pits.
Mining operations will be based on 365 operating days per year with two 12-hour shifts per day. An allowance of 10 days of no mine production has been built into the mine schedule to allow for adverse weather conditions. The mining fleet will include diesel-powered down the hole (DTH) drills with 165mm bit size for production drilling, diesel-powered RC (reverse circulation) drills for bench-scale grade control drilling, 12 m3 bucket size diesel hydraulic excavators, and 13 m3 bucket-sized wheel loaders for production loading, and 91 t payload rigid-frame haul trucks and 36 t articulated trucks for production hauling, plus ancillary and service equipment to support the mining operations. In-pit dewatering systems will be established for each pit. All surface water and precipitation in the pits will be handled by submersible pumps.
The mine equipment fleet is planned to be purchased via a lease financing arrangement. Owner-managed maintenance on mine equipment will be performed in the field with major repairs in the shops located near the primary crusher.
Milling
The Garrison Process Plant employs standard Carbon-In-Leach (CIL) technology along with gravity concentration for gold recovery. The plant includes crushing, grinding, gravity concentration, classification, leach and CIL, and detoxification before deposition into a Tailings Storage Facility. The plant will treat 4.0 Mt of ore per year at an average throughput of 11,000 tonnes per day.
The mill design availability is 8,059 hours per year or 92%. The plant has been designed to realize an average recovery of 89.8% (92.3% Au during initial high-grade production) of the gold over the life of the project based on metallurgical test work completed at various laboratories in Canada and the USA between 2011 and 2018. Of this, 24.5% of the gold will be extracted by the gravity circuit and a further 65.3% by the leach/CIL process.
Figure 2: Site Plan
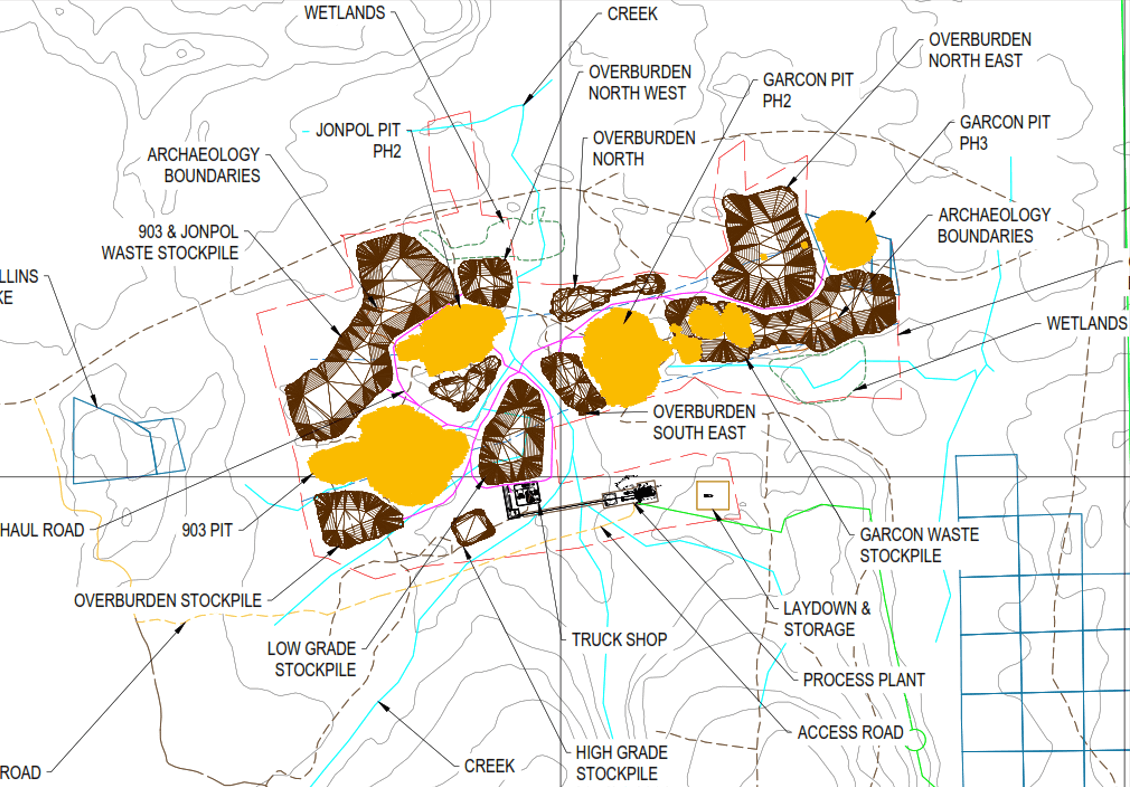
Tailings storage capacity has been identified to safely accommodate the life of mine production as described in this PEA. Tailings produced over the first eight years of mine operation will be accommodated in a new tailings storage facility to be constructed south of the open pits The tailings storage facility perimeter containment dams will be constructed with waste rock and overburden from open pit mine development and will utilize the downstream construction method to ensure safe tailings storage over the long-term.
Runoff from the tailings storage facility will be collected in an adjacent water management pond. In order to allow mining of the Garrcon Pit – Phase #3 in Year 4, the adjacent highway will be diverted to the North.
Capital and Operating Costs
The total pre-production capital cost for the Garrison Project is estimated to be $267M including allowances for indirect costs and contingency of $29M and $38M respectively. Sustaining capital costs are estimated at $126M, including closure costs (Table 6). Operating costs are estimated at $22.1 per tonne milled (Table 7).
Table 6: Total Capital and Operating Costs
| COST AREA DESCRIPTION | INITIAL CAPITAL COST ($M) | SUSTAINING CAPITAL COST ($M) | TOTAL CAPITAL COST ($M) |
| Mining | $40 | $113 | $153 |
| Processing | $115 | — | $115 |
| Infrastructure (and Tailings) | $35 | $13 | $48 |
| Indirect Costs | $29 | — | $29 |
| Owner’s Project Costs | $9 | — | $9 |
| Contingency | $38 | — | $38 |
| Total | $267 | $126 | $393 |
Table 7: Total Life of Mine Operating Costs
| COST AREA | LOM ($M) | ANNUAL AVG. COST ($M) | AVG. LOM ($/T MINED) | AVG.LOM ($/T MILLED) | AVG. LOM (US$/OZ) | OPEX (%) |
| Total Mine Operating Costs Including Reclaiming Costs | $469 | $39 | $2.7 | $9.9 | $313 | 45% |
| Total Mill Processing Including Water Treatment Costs | $532 | $44 | $3.0 | $11.2 | $355 | 51% |
| Total G&A Costs | $45 | $4 | $0.3 | $1.0 | $30 | 4% |
| Total | $1,047 | $87 | $6.0 | $22.1 | $698 | 100% |
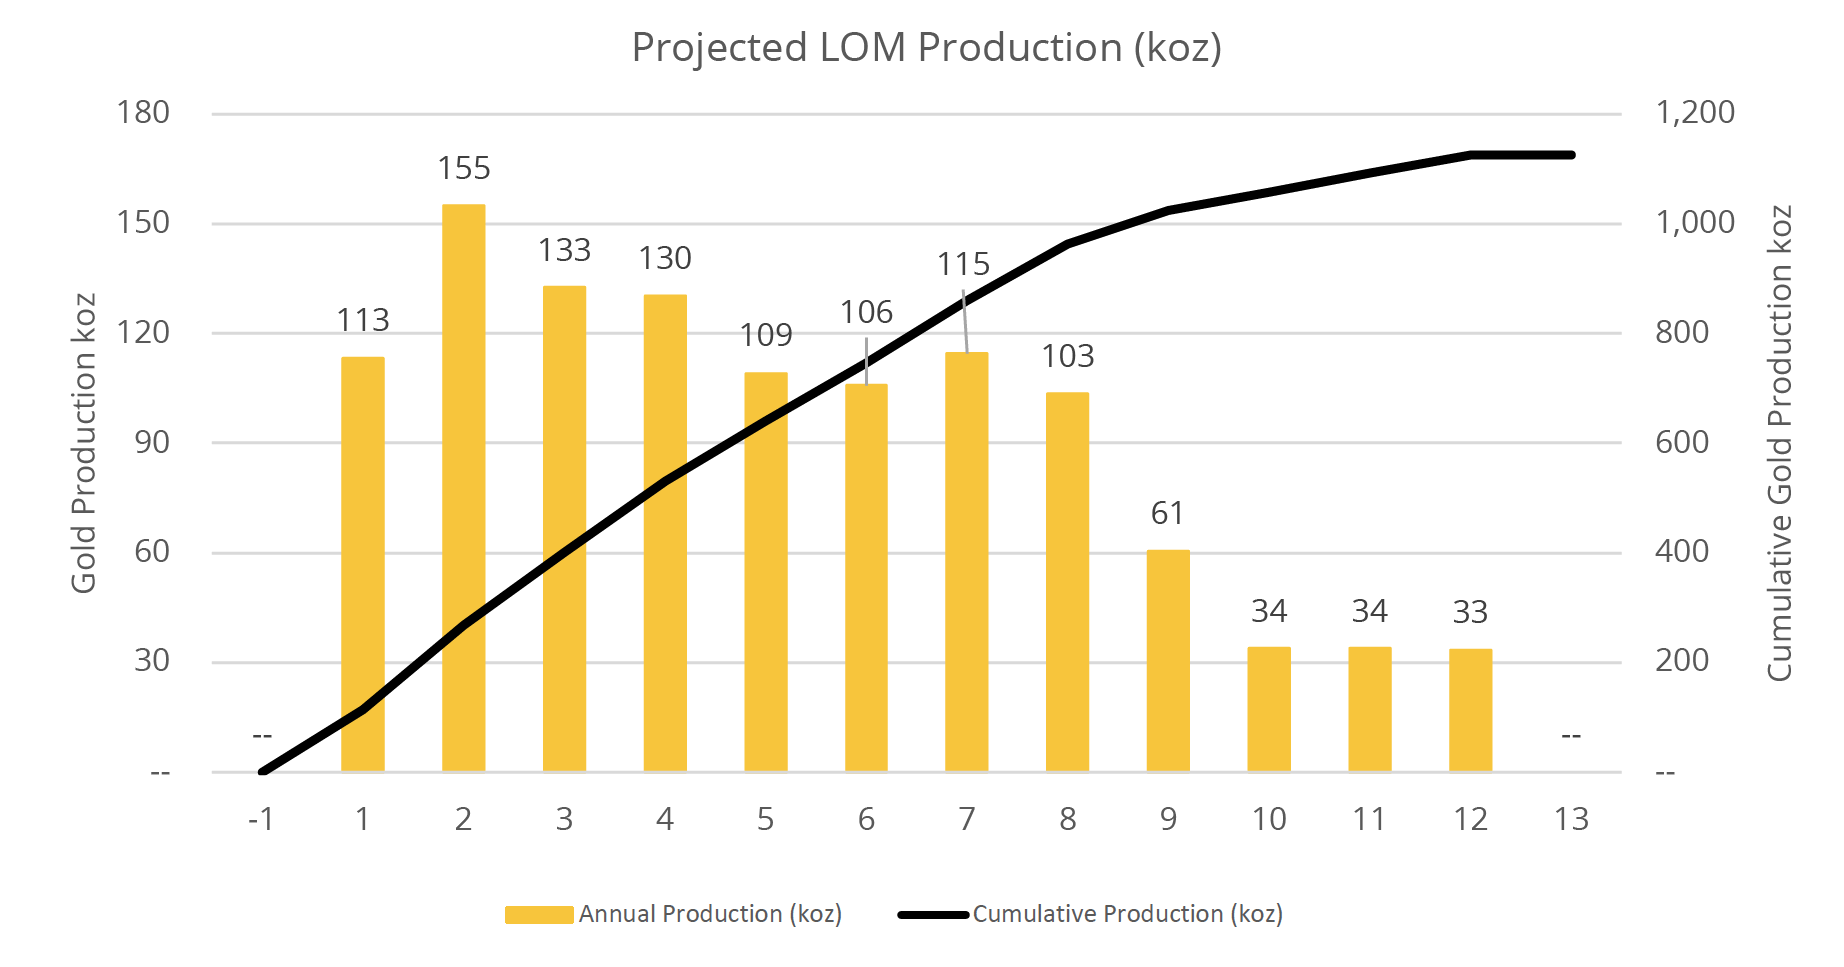
Gold Production
Projected gold production averages 121,000 ounces per year over years 1 to 8, peaking at 155,000 ounces in year two. The LOM production averages 94,000 ounces per year.
Figure 3: Projected LOM Production (koz)
Opportunities to further increase NPV
Database refinement and additional QAQC work along with infill drilling could upgrade the classification from Inferred to Indicated or Measured. Additional structural and geologic studies as well as step-out drilling along strike of the mineralization could extend the resource both laterally and at depth.
The PEA mine plan does not exploit the entire Mineral Resource. There is project expansion opportunity to be further investigated during the next study phase, which could include more, or all, of the additional Mineral Resource.
Additional metallurgical test work will be targeted at increasing the leach feed grind size, and assessing a wider variability of resource hardness, to in turn reduce mill equipment sizing. Additional testing of JonPol samples to improve recoveries should also be completed.
Next Steps
The results of the PEA indicate that the proposed Project has technical and financial merit using the base case assumptions. It has also identified additional field work, metallurgical test work, trade-off studies and analysis required to support more advanced mining studies.
The Qualified Persons (“QP”) consider the PEA results sufficiently reliable and recommend that the Garrison Project be advanced to the next stage of development through the initiation of a pre-feasibility study and working towards completion of an Environmental Impact Study for the Project while exploring the geological potential of the Garrison project.
PEA Details
The independent PEA was prepared through the collaboration of the following firms: Ausenco, and Moose Mountain Technical Services. These firms provided mineral resource estimates, design parameter and cost estimates for mine operations, process facilities, major equipment selection, waste and tailings storage, reclamation, permitting, and operating and capital expenditures. Table 8 summarizes the contributors and their area of responsibility.
Table 8: Consulting Firm and Area of Responsibility
| CONSULTING FIRM | AREA OF RESPONSIBILITY |
| Ausenco Engineering Canada | - Metallurgical test work development and analysis;
- Mass balance;
- Process plant design;
- Process plant capital costs and operating costs;
- Electrical and IT infrastructure design and costs;
- Design and costs of utilities and infrastructure including on-site roads;
- Material transport and General and administration operating costs;
- Financial Analysis and overall NI 43-101 integration;
- Water treatment plant design, capital and operating costs;
- Tailings, ore and waste rock management facility designs and costs;
- Surface water management infrastructure design and costs;
- Site wide water balance;
- Rock mass characterization and rock mechanics input to pit design;
- Hydrogeology;
- Geotechnical input for surface infrastructure design;
- Waste rock, tailings, and ore geochemical characterization;
- Groundwater quality input to environmental studies;
- Environmental studies, permitting and closure costs;
- Regulatory context, social considerations, and anticipated environmental issues.
|
| Moose Mountain Technical Services | - Historical data review;
- Current and historical geology, exploration, drilling;
- Sample preparation and QAQC, and data verification;
- Mineral resource estimate (O3 completed geological modelling of ore bodies);
- Geotechnical input for pit design;
- Mine and mine infrastructure design;
- Mine production scheduling; and
- Mine capital costs and operating costs.
|
Qualified Person
All technical information, not pertaining to the PEA, in this news release has been reviewed and approved by Mr. Louis Gariepy, Eng. (OIQ #107538), VP Exploration, who is a “qualified person” as defined by NI 43-101).
The PEA has been prepared by Ausenco. The contributors to the report are QPs under NI 43-101 and are independent of O3 Mining for the purposes of the NI 43-101. The technical content of the PEA and this press release has been reviewed and approved by:
Tommaso Roberto Raponi, P.Eng, Process and Infrastructure
Scott Elfen, P.E., Tailings and Water Management
Mike Petrina, P.Eng, Mining
Sue Bird, P.Eng, Resource Estimate
Scott Weston, P.Eng, Environment
Quality Control and Reporting Protocols
The primary lab for O3 Mining is SGS in Cochrane, Ontario is an independent accredited laboratory. The core samples shipped to SGS are crushed to 75% passing -2 mm (10 mesh), a 250 g split of this material is pulverized to 85% passing 75 microns (200 mesh) and 30 g is analyzed by Fire Assay (FA) with an inductively coupled plasma atomic emission spectroscopy (ICP-AES) finish. For samples with visible gold or metallic minerals, or initial fire assay values greater than 3g/t, the metallic screen lead fire assay is used. A sample of certified standard material, a duplicate and a blank are inserted by O3 Mining’s geologists into each set of 20 submitted samples as part of the Quality Assurance, Quality Control (“QAQC”) program. Duplicate pulps are submitted to the secondary laboratory, Bureau Veritas, as part of the check assay program.
For drilling in the 2000s, prior to ownership by O3 Mining, the assaying and QAQC program was similar to that employed by the Corporation and has been reviewed. Some samples of historic core have been re-assayed during the modern era assay program. To the extent historic core logs exist for the historic drilling, they have been reviewed. The drill program design, QAQC and interpretation of results are performed by qualified persons employing a QAQC program consistent with NI 43-101 and industry best practices.
Non-IFRS Financial Measures
The Corporation has included certain non-IFRS financial measures in this news release, such as Initial Capital Cost, Cash Operating Costs, Total Cash Cost, All-In Sustaining Cost, Expansion Capital and Capital Intensity, which are not measures recognized under IFRS and do not have a standardized meaning prescribed by IFRS. As a result, these measures may not be comparable to similar measures reported by other corporations. Each of these measures used are intended to provide additional information to the user and should not be considered in isolation or as a substitute for measures prepared in accordance with IFRS.
Non-IFRS financial measures used in this news release and common to the gold mining industry are defined below.
Total Cash Costs and Total Cash Costs per Ounce
Total Cash Costs are reflective of the cost of production. Total Cash Costs reported in the PEA include mining costs, processing & water treatment costs, general and administrative costs of the mine, off-site costs, refining costs, transportation costs and royalties. Total Cash Costs per Ounce is calculated as Total Cash Costs divided by payable gold ounces.
All-in Sustaining Costs (“AISC”) and AISC per Ounce
AISC is reflective of all of the expenditures that are required to produce an ounce of gold from operations. AISC reported in the PEAS includes total cash costs, sustaining capital, closure costs and salvage, but excludes corporate general and administrative costs. AISC per Ounce is calculated as AISC divided by payable gold ounces.
About O3 Mining Inc.
O3 Mining, which forms part of the Osisko Group of companies, is a mine development and emerging consolidator of exploration properties in prospective gold camps in Canada – focused on projects in Québec and Ontario – with a goal of becoming a multi-million ounce, high-growth company.
O3 Mining is well-capitalized and holds a 100% interest in properties in Québec (133,557 hectares) and Ontario (25,000 hectares). O3 Mining controls 66,064 hectares in Val-d’Or and over 50 kilometres of strike length of the Cadillac-Larder Lake Fault. O3 Mining also has a portfolio of assets in the Chibougamau region of Québec.
About Ausenco
Ausenco is a global company redefining what’s possible. Our team is based across 26 offices in 14 countries, with projects in over 80 locations worldwide. Combining our deep technical expertise with a 30-year track record, we deliver innovative, value-add consulting studies, project delivery, asset operations and maintenance solutions to the mining & metals, oil & gas and industrial sectors. We find a better way.
Cautionary Note Regarding Forward-Looking Information
This news release contains “forward-looking information” within the meaning of the applicable Canadian securities legislation that is based on expectations, estimates, projections and interpretations as at the date of this news release. The information in this news release about the transaction; and any other information herein that is not a historical fact may be “forward-looking information”. Any statement that involves discussions with respect to predictions, expectations, interpretations, beliefs, plans, projections, objectives, assumptions, future events or performance (often but not always using phrases such as “expects”, or “does not expect”, “is expected”, “interpreted”, “management’s view”, “anticipates” or “does not anticipate”, “plans”, “budget”, “scheduled”, “forecasts”, “estimates”, “believes” or “intends” or variations of such words and phrases or stating that certain actions, events or results “may” or “could”, “would”, “might” or “will” be taken to occur or be achieved) are not statements of historical fact and may be forward-looking information and are intended to identify forward-looking information. This forward-looking information is based on reasonable assumptions and estimates of management of the Corporation, at the time it was made, involves known and unknown risks, uncertainties and other factors which may cause the actual results, performance or achievements of the companies to be materially different from any future results, performance or achievements expressed or implied by such forward-looking information. Such factors include, among others, risks relating to the restart of operations; further steps that might be taken to mitigate the spread of COVID-19; the impact of COVID-19 related disruptions in relation to the Corporation’s business operations including upon its employees, suppliers, facilities and other stakeholders; uncertainties and risk that have arisen and may arise in relation to travel, and other financial market and social impacts from COVID-19 and responses to COVID 19. Although the forward-looking information contained in this news release is based upon what management believes, or believed at the time, to be reasonable assumptions, the parties cannot assure shareholders and prospective purchasers of securities that actual results will be consistent with such forward-looking information, as there may be other factors that cause results not to be as anticipated, estimated or intended, and neither the Corporation nor any other person assumes responsibility for the accuracy and completeness of any such forward-looking information. The Corporation does not undertake, and assumes no obligation, to update or revise any such forward-looking statements or forward-looking information contained herein to reflect new events or circumstances, except as may be required by law.
Neither the TSX Venture Exchange nor its Regulation Services Provider (as that term is defined in the policies of the TSX Venture Exchange) accepts responsibility for the adequacy or accuracy of this news release. No stock exchange, securities commission or other regulatory authority has approved or disapproved the information contained herein.
For further information on O3 Mining, please contact:
José Vizquerra
President, CEO and Director
Telephone: (416) 363-8653

 Financing